
Why Learning Technical Analysis Can Change How You Understand Markets
Imagine opening a stock chart for the first time. You see green and red candles moving up and down, strange lines across the screen, and numbers that seem to change every second. At first, it can feel confusing. However, once you understand what the chart is actually telling you, the picture becomes much clearer.Technical Analysis is a method of studying price movements, trading volume, market trends, and chart patterns to identify possible future price movements. It is widely used by traders and investors to make more structured decisions instead of depending only on emotions, rumours, or random tips.
For students, fresh graduates, and career starters, learning market-related skills can also build valuable analytical thinking. Someone exploring best digital marketing courses, finance, business, analytics, or entrepreneurship can benefit from understanding how data is interpreted before making decisions.
This guide explains Technical Analysis in simple language. You will learn how charts work, which indicators matter, common patterns, practical strategies, mistakes to avoid, and how beginners can develop their skills responsibly.
What Is Technical Analysis and How Does It Work?
At its simplest, Technical Analysis means studying historical market data to identify patterns and trends.
Instead of asking, “Is this company good?”, technical analysts often ask questions such as:
- Is the price trending upward or downward?
- Where have buyers entered previously?
- Where have sellers become active?
- Is trading volume increasing?
- Is the current price close to an important support or resistance level?
- Does the chart show a recognizable pattern?
The basic idea is that market prices reflect the combined actions of buyers and sellers. By studying those actions over time, traders attempt to identify opportunities and manage risk.
It is important to understand that technical analysis does not predict the future with certainty. A pattern that worked previously can fail in a completely different market environment.
Technical Analysis vs Fundamental Analysis
A common beginner question is whether Technical Analysis or fundamental analysis is better.
The answer depends on the objective.
| Factor | Technical Analysis | Fundamental Analysis |
|---|---|---|
| Main focus | Price and volume | Business and financial health |
| Common users | Traders and active investors | Long-term investors |
| Main tools | Charts and indicators | Financial statements |
| Time horizon | Short to medium term | Medium to long term |
| Key question | What may price do next? | What may the business be worth? |
For example, a long-term investor may examine revenue growth, profits, debt, management, and industry conditions. A trader may focus more heavily on price structure, volume, moving averages, and momentum.
Learning both approaches can provide a broader understanding of financial markets.
Technical Analysis Basics Every Beginner Should Learn
Before using advanced indicators, beginners should understand a few fundamental concepts.
Price Charts
A chart shows how an asset’s price has changed over a selected period. Common chart types include line charts, bar charts, and candlestick charts.
Candlestick charts are particularly popular because each candle can show the opening price, closing price, highest price, and lowest price for a specific period.
A single candle tells you what happened during that period. A series of candles can reveal a larger market structure.
Trends
A trend describes the general direction of price movement.
An uptrend generally contains higher highs and higher lows. A downtrend tends to create lower highs and lower lows. When price moves within a relatively defined range, the market may be described as sideways or range-bound.
Recognising the trend is one of the first skills beginners should develop.
Support and Resistance
Support is an area where buying interest has historically helped prevent or slow further price declines.
Resistance is an area where selling pressure has previously limited upward movement.
These levels are not magical lines. They are better understood as zones where market participants may react.
Technical Analysis Indicators You Should Understand
Indicators can help organise market information, but using too many indicators can make a chart harder to understand.
Moving Averages
Moving averages smooth price data over a selected period. Traders commonly use them to identify trends and possible dynamic support or resistance.
For example, a trader might compare a shorter moving average with a longer one to understand whether momentum is changing.
Relative Strength Index
The Relative Strength Index, commonly called RSI, measures price momentum on a scale from 0 to 100.
Many traders use traditional levels such as 70 and 30 as starting points for identifying potentially overbought or oversold conditions. However, these levels should not automatically be treated as buy or sell signals.
A strong asset can remain above traditional overbought levels during a powerful uptrend.
Moving Average Convergence Divergence
MACD is another popular momentum and trend-following indicator. It uses moving averages to help traders examine changes in momentum.
The indicator can be useful when combined with price action and broader market context.
Trading Volume
Volume shows how much of an asset has been traded during a particular period.
Suppose a stock breaks above a major resistance zone while trading volume increases significantly. Some traders may consider that more meaningful than a breakout accompanied by very low volume.
Volume should still be interpreted alongside price movement rather than viewed independently.
How to Read Technical Analysis Chart Patterns
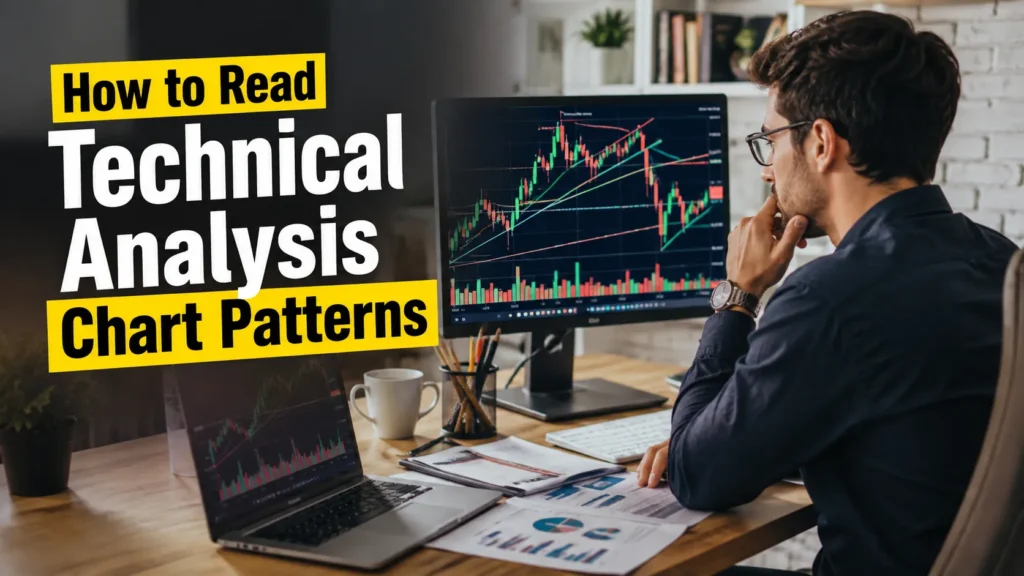
Chart patterns are formations that traders watch for because they may indicate continuation or reversal.
Common examples include:
Double Top: A potential reversal pattern that can appear after an upward movement.
Double Bottom: A potential bullish reversal formation following a decline.
Head and Shoulders: A pattern often associated with a possible trend reversal.
Triangles: Consolidation patterns that can appear before a significant price movement.
Flags and Pennants: Short-term formations that may occur during strong trends.
Patterns should never be treated as guaranteed outcomes. Confirmation, market conditions, volume, and risk management remain important.
A Simple Technical Analysis Example
Consider a fictional stock called ABC Ltd.
The price has moved from ₹100 to ₹145 over several weeks. It then falls toward ₹130 and finds buying interest around that region several times.
A beginner might simply think, “The price has fallen, so it must be cheap.”
A more disciplined approach would ask:
Has ₹130 acted as support previously?
Is the broader trend still upward?
Has selling pressure weakened?
Is volume increasing when buyers return?
Is there a reasonable risk-to-reward opportunity?
This difference is important. Technical Analysis is not simply about finding a chart pattern. It is about creating a structured decision-making process.
Technical Analysis Step-by-Step Guide for Beginners
If you are completely new, avoid jumping between dozens of indicators.
Follow a simple process.
Step 1: Select One Market
Start with one market or asset category instead of trying to understand everything simultaneously.
Step 2: Choose a Timeframe
Decide whether you are studying short-term, swing, or longer-term movements.
Step 3: Identify the Trend
Look for higher highs and higher lows, lower highs and lower lows, or sideways movement.
Step 4: Mark Support and Resistance
Identify important areas where price has reacted previously.
Step 5: Study Volume
Check whether major price movements are supported by meaningful changes in trading activity.
Step 6: Add One or Two Indicators
Start with simple tools such as a moving average or RSI. Learn how they behave before adding anything else.
Step 7: Define Risk
Before considering a trade, determine where your idea would be proven wrong.
Step 8: Record the Decision
Maintain a journal containing the setup, reasoning, entry idea, exit plan, and result.
This process can help beginners learn from decisions instead of remembering only their successful trades.
Real-Life Learning Case Study: From Guessing to a Process
Consider a hypothetical college graduate named Rahul.
Rahul sees a stock rising rapidly on social media. Several people are claiming that it will double soon. He buys without researching the chart or defining a risk limit.
The price reverses.
Rahul panics and exits after a significant decline.
Later, he begins learning Technical Analysis. Instead of following social media excitement, he studies trend direction, support, resistance, volume, and position sizing.
His results do not suddenly become perfect. Instead, his decisions become more structured.
That is the real value of learning market analysis. The goal is not to eliminate uncertainty. The goal is to make decisions with a defined process.
Technical Analysis and Risk Management
One of the biggest misconceptions among beginners is that a good strategy can eliminate losses.
It cannot.
Even a strong setup can fail because of unexpected news, market-wide selling, economic changes, liquidity conditions, or simple randomness.
Risk management therefore deserves as much attention as chart analysis.
A beginner should understand:
- How much capital is being placed at risk.
- Where the trade idea becomes invalid.
- Whether the potential reward justifies the risk.
- How emotional reactions may affect decisions.
- Why excessive leverage can magnify losses.
Never use money you cannot afford to lose for speculative activity.
Common Technical Analysis Mistakes Beginners Make
Using Too Many Indicators
Adding RSI, MACD, several moving averages, Bollinger Bands, stochastic indicators, and numerous trend lines can create information overload.
Start simple.
Treating Indicators as Guaranteed Signals
No indicator knows what will happen next.
An indicator should support analysis, not replace judgement.
Ignoring the Bigger Trend
A small bullish pattern inside a powerful downtrend may not mean the market has completely reversed.
Always consider the broader structure.
Following Social Media Tips Blindly
A viral post is not a trading strategy.
Before acting on someone Elysee’s idea, understand the reasoning behind it and perform your own analysis.
Trading Without a Plan
Entering first and deciding what to do later can turn a small mistake into a much larger one.
A plan should exist before taking a position.
Technical Analysis Checklist for Beginners
Before analysing a potential setup, ask yourself:
- What is the current market trend?
- Where are the major support and resistance zones?
- What does volume suggest?
- Is there a clear chart structure?
- Which indicator supports the idea?
- What would invalidate the setup?
- Is the risk acceptable?
- Am I making this decision because of analysis or emotion?
- Have I recorded the reasoning?
If you cannot answer these questions clearly, slow down.
How Students Can Build Technical Analysis Skills
Students and fresh graduates do not need to become professional traders overnight.
Start by learning basic financial terminology. Then study chart structures using historical data. Create a paper-trading journal and review previous market movements.
This approach can be particularly useful for skill development learners who want to build analytical capabilities alongside their academic education.
Someone pursuing internship training courses can also apply the same learning philosophy: understand the fundamentals, practise repeatedly, document results, and improve through feedback.
For students interested in digital careers, combining financial knowledge with technology, spreadsheets, data analysis, or digital marketing can create a broader professional skill set. Those exploring a digital marketing course in Indore or digital marketing training in Indore can similarly benefit from learning how data influences decisions.
Career Opportunities Related to Market and Data Skills

Learning market analysis does not automatically make someone a professional trader. However, financial markets connect with several career areas, including research, financial analysis, investment operations, fintech, business analytics, and financial content.
Students can build complementary skills such as Excel, statistics, Python, data visualisation, financial modelling, and communication.
This is similar to choosing a career-focused programme such as a best digital marketing course in Indore, where practical projects can be more valuable than simply collecting certificates.
The important lesson is to build skills that can be demonstrated through projects.
Industry Trends: Where Technical Analysis Is Heading
Modern market analysis is increasingly influenced by technology.
Charting platforms now provide automated indicators, alerts, backtesting tools, screeners, and large volumes of historical data. Artificial intelligence is also being explored for pattern recognition, sentiment analysis, and automated research.
However, technology does not remove risk.
A sophisticated model can still produce a poor decision when the underlying assumptions are wrong.
For beginners, the best approach is to understand the fundamentals first and then use technology to improve efficiency.
Technical Analysis Success Story: What Progress Really Looks Like
A realistic success story is not someone who predicts every market movement.
Imagine a learner who spends three months studying charts and initially makes inconsistent decisions. Instead of chasing quick profits, they create a journal containing 50 hypothetical setups.
After reviewing the results, they discover that they repeatedly enter too early.
They adjust their process and begin waiting for confirmation.
The improvement comes from learning, measuring, and correcting mistakes.
That mindset is valuable far beyond financial markets.
Interactive Questions: Test Your Understanding
Suppose a stock is making higher highs and higher lows. Would you describe the broader structure as bullish, bearish, or sideways?
Now imagine the price reaches a previous resistance level and trading volume suddenly increases. What additional information would you want before making a decision?
Finally, if an indicator says “buy” while the broader price structure looks weak, should you automatically enter?
These questions demonstrate an important principle: good analysis requires context.
Practical Tips to Improve Your Analysis
Start with one strategy instead of collecting dozens.
Study historical charts regularly. Pause before looking at what happened next and write down your expectation.
Then compare your prediction with the actual outcome.
Keep a journal.
Review losing decisions without blaming yourself. Ask whether the problem was the strategy, execution, risk management, or emotional decision-making.
Most importantly, avoid confusing confidence with competence.
Confidence grows when knowledge is supported by repeated practice.
Frequently Asked Questions About Technical Analysis
Is Technical Analysis suitable for beginners?
Yes. Beginners can learn the basic concepts, including trends, support, resistance, volume, candlestick charts, and simple indicators. Start with education and simulated practice rather than rushing into real-money trading.
How long does it take to learn Technical Analysis?
Basic concepts can be learned relatively quickly, but developing practical skill takes consistent study and chart observation. There is no fixed timeline for becoming proficient.
Is Technical Analysis better than fundamental analysis?
Neither approach is universally better. They answer different questions and can sometimes be combined.
Can Technical Analysis guarantee trading profits?
No. Markets are uncertain, and no chart pattern or indicator guarantees a profitable outcome.
Which indicators should beginners learn first?
Moving averages, RSI, MACD, and volume are common starting points. Beginners should focus on understanding a few tools instead of using everything available.
Can students learn Technical Analysis?
Yes. Students can learn the fundamentals through books, educational resources, historical charts, simulations, and structured practice. Financial markets should be approached responsibly.
Final Takeaway: Learn Before You Trade
Technical Analysis is much more than colourful candles and complicated indicators.
It is a framework for studying market behaviour, identifying trends, evaluating price structures, and managing decisions with greater discipline.
For students, fresh graduates, and career starters, the bigger lesson is equally valuable: learn how to work with information before making decisions.
Whether you are exploring finance, analytics, entrepreneurship, or a career-focused programme such as the best digital marketing institute in Indore, practical learning matters. Students researching the top digital marketing institute in Indore, digital marketing classes in Indore, or best internship courses should look for programmes that emphasise real projects, measurable skills, and hands-on learning.
If you are searching for a digital marketing internship in Indore, an internship company in Indore, or structured internship training courses, focus on opportunities where you can practise skills rather than simply collect a certificate.
The same principle applies to market education.
Learn the basics. Practise patiently. Track your decisions. Review your mistakes. Keep improving.
Your next step: choose one chart, identify its trend, mark its support and resistance levels, observe volume, and write down your reasoning. Do not worry about being perfect. Focus on becoming more disciplined with every analysis.
For career starters, that habit of learning, testing, and improving can become one of the most valuable skills you develop.
Frequently Asked Questions
Can I learn Technical Analysis without a finance degree?
Yes. A finance degree is not required to understand basic chart analysis. Consistent learning and practical study are more important at the beginner level.
Should I use real money while learning?
Beginners should consider learning through historical charts or simulated trading before risking real capital.
What is the most important Technical Analysis skill?
Understanding price structure and risk management is more important than memorising dozens of indicators.
Is Technical Analysis useful for long-term investors?
It can provide additional information about market timing and price behaviour, although long-term investors may also place significant emphasis on fundamental factors.
Where should beginners start?
Start with candlesticks, trends, support and resistance, volume, one moving average, and basic risk management. Build from there.